Challenges of Building Energy Metrics
Mon, Jul 27, 2009 Erik Ring Interior Design, Corporate Facilities, Energy Efficiency, Erik Ring, Energy Services, LEED
 Measuring the energy use in a building is not difficult, but developing fair metrics to compare energy use between buildings is tricky. Every building has somewhat unique use, climate, and occupancy patterns which influence energy consumption, in addition to the energy efficiency of the building design and operations. And most buildings use multiple forms of energy, including electricity produced by everything from coal-fired power plants to on-site renewable energy systems. With so many factors at play, reasonably comparing the energy, environmental and economic differences between how different buildings consume energy is no simple task.
Various rating systems that LPA uses to evaluate the energy performance of a building each rely on subtly different energy metrics.
- Title-24 uses a weighted "Time-Dependent Valuation" of the predicted total energy per square foot, per year (TDV-kBTU/sf-yr).
- Savings By Design incentives are based on Title-24 calculations, but also on the overall predicted electrical savings (kWh/yr) and natural gas savings (therms/yr).
- LEED-NC uses predicted energy cost ($/yr) as the primary energy metric following the lead of ASHRAE Standard 90.1.
- LEED-EB uses the EPA EnergyStar Buildings program which is based on the measured (not modeled) Energy Use Intensity or EUI (kBTU/sf-yr). EnergyStar normalizes buildings against similar facilities in the US Department of Energy's CBECS database.
- Many in our industry argue that carbon metrics (which take into account the emissions of the energy generation) should be how buildings are evaluated.
 The same facility can fare differently in each of these programs depending on whether measured or modeled energy data is used and which energy metric is used.
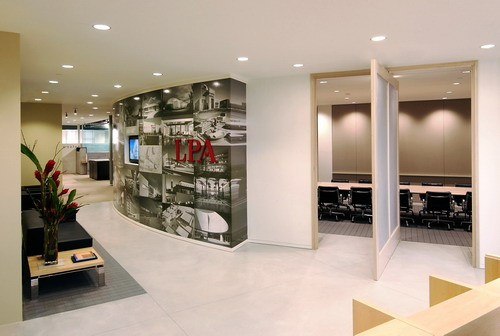
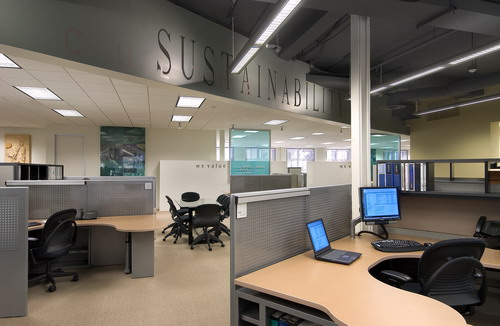
Take LPA's Irvine office as an example. We have 192 full-time equivalent employees working in 32,000 gsf on the first floor of our LEED-CI certified office space. In 2008, our EUI was 115 kBTU/sf-yr (down three percent from 2007 and five percent from 2006). This EUI only gets us an EnergyStar score of around 40 nowhere near the 68 EnergyStar score required as a minimum for LEED-EB certification.
But looking closer at the 2003 CBECS data, the ‘average' U.S. office space has an EUI of 92.9 KBTU/sf-yr (LPA's EUI is 23 percent higher). But the average CBECS office space also occupies 434 sf per person, while LPA Irvine occupies less than 170 sf per person. We use our collaborative, open office space more intensely by more (hard-working, smart and dedicated) professionals than the "typical" U.S. office.
If we change the metric to energy use per person, the typical office uses 40.3 MBTU per worker while LPA uses only 19.1 MBTU per worker --- 53 percent less than ‘average.'
In theory LPA could dramatically expand our office space, give our staff more elbow room, see our total costs for rent and utilities go up, while our collaboration and productivity went down, and improve our EUI and EnergyStar score in the process. This would not make us a stronger, greener, or more energy efficient firm, even if one way of measuring energy performance would indicate as much.
Buildings that are vastly under-utilized have low energy bills and EUI numbers --- but this is not a real sign of success, efficiency, or sustainability.
At LPA we strive to understand the impact of our design work, while also keeping in mind that no single metric or measurement can capture the overall design quality or environmental performance of a building.
Erik Ring, LEED AP, PE is Director of Mechanical Engineering at California-based LPA Inc. He has consulted on or designed more than two dozen LEED Certified projects, and taught the LEED rating system to more than 2,800 building professionals. Ring is a licensed mechanical engineer with a concentration in designing high performance HVAC systems and energy efficient commercial buildings.